ILO #1) Represent and interpret information in numeric, symbolic, or graphical forms.
Note from instructor: Parts (a), (b), and (d) are particularly relevant to QCR ILO 1
(1) Suppose S(t) is the number of inches of snow on the ground t hours after midnight.
(a) (6 pts) For each equation below, write a sentence describing the meaning. Include correct units.
(i) S(2) = 0.9
(ii) S′(2) = 0.6
(b) (4 pts) A student measures the amount of snow on the ground every two hours and records their measurements below. Use the table to estimate S′(6).
| t | 0 | 2 | 4 | 6 | 8 | 10 | 12 |
|---|---|---|---|---|---|---|---|
| S(t) | 0 | 0.9 | 2.1 | 5.3 | 6.7 | 7.9 | 7.9 |
(c) (4 pts) Suppose S′(8) = 0.6. Write the equation of the tangent line to S(t) at t = 8.
(d) (3 pts) Use your equation from part (c) to estimate how much snow is on the ground when t = 9.
(e) (3 pts) Based on the table, which value is most likely to be larger, S′(4) or S′(10)? Explain your reasoning.
Assignment 3
Supply and Demand
1. In the market for chocolates, the following table depicts the demand for ice-cream by Peter, Tony and Steve at the given prices.
| Price | Quantity – Peter | Quantity – Tony | Quantity – Steve |
|---|---|---|---|
| $12 | 5 | 4 | 11 |
| $10 | 6 | 6 | 13 |
| $8 | 7 | 8 | 15 |
| $6 | 8 | 10 | 17 |
| $4 | 9 | 12 | 19 |
| $2 | 10 | 14 | 21 |
(a) If the market consists of Peter, Tony, and Steve and the price falls from $6 to $4, the quantity demanded in the market increases by?
(b) If the market consists of Peter and Tony only and the price falls from $6 to $4, the quantity demanded in the market increases by?
(c) If the market consists of Peter and Steve only and the price falls from $6 to $4, the quantity demanded in the market increases by ?
(d) If the market consists of Tony and Steve only and the price falls from $6 to $4, the quantity demanded in the market increases by ?
2. Suppose that the federal government is concerned about obesity in the United States. Congress is considering a plan which would require “junk food” producers to include warning labels on all junk food. If the warning labels are successful, we could illustrate the plan as producing a movement from
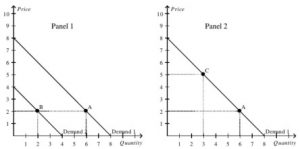
(a) Point A to Point B in Panel 1.
(b) Point B to Point A in Panel 1.
(c) Point A to Point C in Panel 2.
(d) Point C to Point A in Panel 2.
3. The federal government now considers an alternate plan, imposing a tax on all products considered to be junk food, thereby increasing the price of all junk food. We could illustrate the tax as producing a movement from
(a) Point A to Point B in Panel 1.
(b) Point B to Point A in Panel 1.
(c) Point A to Point C in Panel 2.
(d) Point C to Point A in Panel 2.
4. How will the following affect the demand curve for chocolate in Belgium. Explain.
(a) An increase in the price of ice-cream, a substitute for chocolate
(b) An increase in the price of chips, a complement to chocolate
(c) Belgium starts exporting chocoloate to other countries
(d) A decrease in the price of chocolate
5. How would the following affect the supply curve for chocolate in Belgium. Explain.
(a) An increase in the price of chocolate
(b) An increase in the price of chips, a complement to chocolate
(c) A decrease in the price of sugar, an input to chocolate
(d) Several grocery stores shut down
6. Using supply-and-demand diagrams, show the effects of the following events on the market for sweatshirts
(a) A hurricane in South Carolina damages the cotton crop.
(b) The price of leather jackets falls.
(c) All schools require sweatshirts as part of their winter uniform
(d) New knitting machines that make sweatshirts more efficiently are invented.
Elasticity and Its Application
1. The owner of a local hot dog stand has estimated that if he lowers the price of hot dogs from $2.00 to $1.50, the quantity demanded will increase from 400 to 500 hot dogs per day. Calculate the price elasticity of demand. Is the demand elastic or inelastic?
2. When the price of fresh fish increases 10%, quantity demanded decreases 5%. The price elasticity of demand for fresh fish is ______ and total revenue from fresh fish sales will ______.
(a) elastic; decrease
(b) elastic; increase
(c) inelastic; decrease
(d) inelastic, increase
3. When the price of fresh fish increases 10%, quantity demanded is unchanged. The price elasticity of demand for fresh fish is ______.
(a) perfectly inelastic.
(b) elastic.
(c) inelastic.
(d) unitary elastic.
4. The price of a good rises from $20 to $28 and the quantity supplied rises from 80 to 120 units. Calculate the price elasticity of supply.
Note from instructors: This prompt, particularly sections D and E which all students completed, is designed to address all 3 QCR ILOs.
[Course Name] Individual Project
By completing this individual project, you will be able to:
- Generate questions that can be answered with provided data.
- Perform EDA for
- a quantitative response variable and a binary explanatory variable
- a quantitative response variable and a categorical explanatory variable (with more than two groups)
- two (binary) categorical variables.
- two categorical variables, where at least one variable has more than two groups
- Perform inference for two means, several means, two proportions, and two categorical variables.
- Write accurate inferential conclusions and interpretations for each of these procedures.
Useful resources for this project:
- Book chapters 16, 17, 18, 20, 21, and 22.
- In class activities from Unit 2: Exploratory Data Analysis, Unit 4: Proportions, Unit 5: Means, and Unit 6: Chi-Square
- Project_data_sets.Rmd (in the Class>Project_Info Folder)
Introduction
As in the Group Project we will be using one of four datasets provided for you. Note that these datasets have been updated to include more categorical variables. Be sure to read the updated Project Data Descriptions for more details.
- Data Set 1: Marathon Runners
- Data Set 2: Canine Assisted Interventions
- Data Set 3: Song characteristics from Spotify
- Data Set 4: Champions League soccer statistics
Notice that the fifth dataset from the previous project (Strength and Conditioning) won’t be available for this project.
The datasets are available under the folder F25/Class/Project_Info/Project_data.
Descriptions of the four datasets are available under the folder F25/Class/Project_Info in the Project_data_sets file.
Overview
- You will be exploring at least two quantitative variables and at least two categorical variables.
- You are encouraged to select variables that can contribute to a broader narrative related to the dataset you chose.
- At the end of the assignment you will write a paragraph summarizing the findings from your analyses so having a thread that connects these analyses will make this stronger (and easier).
- You can build on questions your group identified in the first project submission, but the questions and analyses presented here should be entirely your own.
- You need only complete two of sections A,B, and C, But each project must complete sections D and E.
Section: Set-up
- Clearly identify the dataset you will be working with. You may continue with the same dataset or choose a different one to explore. Load in that dataset and provide a brief overview of origin of the data. You should answer the “what, where, who, how, why” of the data collection in this description.
Section A: Two-means
- Select a quantitative response variable and binary categorical explanatory variable. Identify a question that can be answered using these two variables. Clearly state this question for a general audience.
- Explore and describe the relationship between the two variables with appropriate summary statistics. Provide one plot and one sentence about the relationship (supported by summary stats).
- Perform the appropriate hypothesis test and report the
- test statistic
- p-value
- 95% confidence interval
- Comment on the role of assumptions/conditions for the test.
- State your statistical conclusion in context.
- Provide an interpretation of the confidence interval in context.
Section B: Several Means
- Select a quantitative response variable and a categorical explanatory variable with more than two groups. Identify a question that can be answered using these two variables. Clearly state this question for a general audience.
- Explore and describe the relationship between the two variables with appropriate summary statistics. Provide one plot and one sentence about the relationship (supported by summary stats).
- Perform the appropriate hypothesis test and report the
- test statistic
- p-value
- Comment on the role of assumptions/conditions for the test.
- State your statistical conclusion in context.
- Perform any additional tests, report your test statistics and p-values, and summarize your statistical conclusions in context. Interpret at least one appropriate 95% confidence intervals in context.
Section C: Two Proportions
- Identify a question that can be answered with two binary categorical variables in the dataset. Clearly state this question for a general audience, identify the explanatory and response variable, and explain the two variables in context of the data collection.
- Explore and describe the relationship between the two variables with appropriate summary statistics. Provide one plot and one sentence about the relationship (supported by summary stats).
- Perform the appropriate hypothesis test and report the
- test statistic
- p-value
- 95% confidence interval
- Comment on the role of assumptions/conditions for the test.
- State your statistical conclusion in context.
- Provide an interpretation of the confidence interval in context.
Section D: Categorical Variables
- Identify a question that can be answered with two categorical variables in the dataset. At least one of these variables will have more than two groups. Clearly state this question for a general audience, and identify the explanatory and response variable.
- Explore and describe the relationship between the two variables with appropriate summary statistics. Provide one plot and one sentence about the relationship (supported by summary stats).
- Perform the appropriate hypothesis test and report the
- test statistic
- p-value
- Comment on the role of assumptions/conditions for the test.
- State your statistical conclusion in context.
Section E: Conclusion and Figure Caption
- Write a paragraph summarizing your findings from your analyses to a general audience.
- In addition to summarizing conclusions, you should consider
- how broadly the results apply (generalizability);
- whether or not there may be confounding variables or if you can make causal conclusions;
- and if there are any shortcomings or limitations to the study or conclusions.
- When presenting findings to a general audience it is common to report confidence intervals and statements of significance (or not) but you should refrain from using words like “null”, “alternative”, “pvalue”, “test-statistic”, etc.
- A strong conclusion should reflect connections between the variables and questions you have chosen to address.
- In addition to summarizing conclusions, you should consider
- Select one Figure from your analyses above that appropriately summarizes an important conclusion from your analyses. For this figure provide a full Figure Caption.
Recall: Figure Captions
A good figure caption has four parts:
- A figure number, which is referred to in the main text (R should automatically assign these).
- Declarative sentence that summarizes the main findings or conclusions of the analysis.
- A brief description of the data and data collection methods necessary to understand the figure. This includes the way the data were measured and the units used.
- A brief description of statistical tests used and other relevant information such as p-values, test statistics, or sample sizes.
Knit this file. Submit your pdf to Moodle.
ILO #2) Identify and use quantitative and computational approaches to solve a problem in context.
Homework 3
Complete the following problems. Write your solutions on a separate page. Make sure you clearly explain your reasoning when applicable and show all of your work. Your explanation and work is more important than your answer.
(Excerpt of homework problem relevant to QCR ILO 2 shown below)
- We’re getting ready for fall season! At a St. Olaf social event, Ole and Sven are distributing hot chocolate from a huge tank. The tank has the shape of an inverted right circular cone with a height of 2 meters and radius 1.5 meters (inverted means tip down). It is initially filled to a height of 1.8 meters with hot chocolate. Find the work required to completely empty the tank by pumping the hot chocolate over the top of the tank. The density of hot chocolate is 1080 kg/m3. Since this is a longer problem, structure your work in the following way:
(a) Briefly describe your approach to the problem.
(b) Set up a mathematical expression that describes the quantity you want to find.
(c) Evaluate this mathematical expression and conclude. Your final answer must include the correct units.
Note from instructor: The Quantitative Analysis section is particularly relevant to QCR ILO 2.
Semester Research Project (55% of Course Grade)
As a major component of this course, you will write a mixed methods research paper that seeks to answer a social science research question and draws on at least two of the methods (one qualitative, one quantitative) covered in class. The goal of this assignment is twofold: first, it will provide you an opportunity to engage in basic research on a political science question of interest to you; and second, it will allow you to compare and contrast the types of claims and conclusions that can be drawn when using different types of research methods.
The research project is broken into five separate submissions, with deadlines spread across the semester. This means that your project is iterative in nature; you are free (and expected) to alter, update, and revise earlier assignments in light of my feedback and your own judgement as you confront new challenges and opportunities in the research process and build toward your final submission.
How To Submit
You will use a single Google Doc throughout the semester for this assignment, and will submit this document using the appropriate links on our Moodle page for the course. You may title it any way you like, and are free to format the paper in whatever way makes the most sense to you. Note that once you submit your document on Moodle, ownership of the file is given to me until I return it back to you. That means you will not be able to make edits after submitting the file, and I will have full access to the document’s version history. While you are free to use online resources to help you with this assignment, I expect your writing to be your own and will be checking the version history for any unusual activity.
Below I’ve provided more detailed information about the requirements and expectations for each of the five required submissions.
Research Paper Topic Proposal (5% of Course Grade)
This component consists of a 1-to-2 paragraph description of your research topic, clear definitions of relevant concepts, your research question(s), any hypotheses you plan to test, and initial thoughts about potential indicators at this early stage of the project. This component is due by 11:59 pm on Monday, September 29th. While you are not required to meet with me before submitting your topic proposal, I am always happy to meet and I would love to chat about your research interests!
Literature Review (10% of Course Grade)
Next, you will write a literature review that summarizes and synthesizes existing scholarship on your topic. This component will help you identify key debates, theoretical approaches, and gaps in the research. Your goal is to demonstrate an understanding of how scholars have approached your topic and to begin situating your own research question within that conversation. Remember, a good literature review provides a synthesis of previous research and critically evaluates the strengths and weaknesses of existing research. The specific requirements for this component are as follows:
- Includes a minimum of 10 academic sources;
- Is between 800-1200 words long;
- Includes a properly formatted bibliography (using APA or Chicago citation styles);
- And is submitted by 11:59 pm on Monday, October 13th
After learning more about what existing research has found with regards to your research topic, you may also wish to revise your research question and any hypotheses from your first submission. Spending some time on this now will save you a great deal of time later in the semester once you begin your actual analyses.
Qualitative Analysis (15% of Course Grade)
You will conduct a small-scale qualitative analysis using one or more of the methods we cover, such as comparative case studies, process tracing, interviews, ethnography, or archival research. You’ll analyze your chosen materials systematically and connect your findings to your research question. The aim is to gain experience with the qualitative methods of political science research and to uncover insights that numbers alone cannot provide. The specific requirements for this component are as follows:
- Is approximately 1500-2500 words long;
- Draws on primary sources or original (i.e. you gathered it yourself) qualitative data;
- States the hypotheses you plan to test with this data;
- Includes a detailed methodology section;
- What this section looks like is contingent on the nature of your project, but there are a few good principles to keep in mind:
- Be as transparent as possible: What method are you using? What sort of data are you using? Where did you get the data in the first place?
- Make an argument for the validity and reliability of your approach
- Justify your case selection or units of analysis
- Justify the evidence to which you are attending (e.g. Why do you focus on certain statements from interviewees and not others?)
- Explain to the reader why they should believe in your conclusions, given your qualitative design – a methods section is really an argument that your approach is rock solid
- What this section looks like is contingent on the nature of your project, but there are a few good principles to keep in mind:
- Includes a section describing your results and analysis;
- For example, this might be where:
- you present interview data and interpret results;
- you walk through a careful process tracing result of a government in transition
- you provide a “thick description” of a community’s political struggles
- As with any paper, this needs to be organized, and you need to clearly show how your fresh and original look at the evidence is supporting your thesis (i.e. your emerging answer to your research question)
- For example, this might be where:
- And is submitted by 11:59 pm on Monday, November 10th
This component is the heart and soul of a traditional qualitative research paper. Even though we are removing some of the other elements (e.g. an introduction; a conclusion), you should think of this as a more traditional academic essay. A few other recommendations to keep in mind:
- Be sure that your qualitative analysis flows naturally from your literature review. Many other smart, hardworking people have investigated similar questions before, and you want your own research to clearly speak to those same issues. This ensures that a reader will understand why your question is important, and what new information your research brings to bear on that question.
- Be sure to make an actual argument. Part of my assessment will be whether the evidence supports your argument. If I can’t tell what the argument is in the first place, no amount of evidence (however good) will help improve your paper. Your argument is likely to be causal or explanatory, though in some cases you might argue that a particular typology (or the like) is most appropriate to understand a particular issue. In either event, you should be able to show this paper to someone who knows very little about the topic, and they should be able to discern your argument, and what evidence is used to support it.
- Be sure to acknowledge your method’s limitations. This might be particularly appropriate to include in the methodology section. For example, perhaps there are some validity issues with your dependent variable. While there may be reasons your design isn’t perfect, you can (and should) argue that this is the best possible approach given resources, etc.
- Be sure to keep everything we’ve talked about in class in mind. I am assessing your knowledge of the research process by seeing how well you apply class concepts to this project. Anticipate possible objections, and justify your approach and your conclusions.
- Finally, do not be afraid to use headings and subheadings! These only serve to help guide your reader and organize your thoughts. For example, if your methodology selection has two main components, say, “case selection” and “results,” you should feel empowered to organize your paper with subheadings for these topics.
Quantitative Analysis (15% of Course Grade)
In addition to the analysis above, you will conduct a small-scale quantitative analysis using one or more of the methods we cover, drawing on content analysis, surveys, experiments, or other observational data (including any statistical analyses). As before, you’ll analyze your chosen materials systematically and connect your findings to your research question. The aim is to gain experience with the quantitative methods of political science research and to uncover insights enabled by the precision of mathematics. The specific requirements for this component are as follows:
- Is approximately 1500-2500 words long;
- Draws on primary sources or original (i.e. you gathered it yourself) quantitative data;
- States the hypotheses you plan to test with this data;
- Includes a detailed methodology section;
- What this section looks like is contingent on the nature of your project, but there are a few good principles to keep in mind:
- Be as transparent as possible: What method are you using? What sort of data are you using? Where did you get the data in the first place?
- Make an argument for the validity and reliability of your approach (i.e. why did you use a survey, experiment, observational data, etc.)
- Explain and justify your measurement approach: How did you operationalize the constructs at hand? Any weakness we should know about? Any important control variables we are accounting for?
- Explain your analytical approach (i.e. what are the statistical tests you used, and why did you use them?)
- Explain to the reader why they should believe in your conclusions, given your quantitative design – remember, a methods section is really an argument that your approach is rock solid
- What this section looks like is contingent on the nature of your project, but there are a few good principles to keep in mind:
- Includes a section describing your results and analysis;
- For example, this might be where:
- you begin with some descriptive statistics to give the reader a feel for the data, before moving into a test of your hypothesis;
- you present group means and test for statistically significant differences;
- you walk through a careful process tracing result of a government in transition you interpret the results of a multiple regression analysis
- As with any paper, this needs to be organized, and you need to clearly show how your fresh and original look at the evidence is supporting your thesis (i.e. your emerging answer to your research question)
- For example, this might be where:
- And is submitted by 11:59 pm on Friday, December 5th
Like before, this component is the heart and soul of a traditional quantitative research paper. Even though we are removing some of the other elements (e.g. an introduction; a conclusion), you should think of this as a more traditional academic essay. A few other recommendations to keep in mind:
- Be sure that your quantitative analysis flows naturally from your literature review. Many other smart, hardworking people have investigated similar questions before, and you want your own research to clearly speak to those same issues. This ensures that a reader will understand why your question is important, and what new information your research brings to bear on that question.
- Be sure to make an actual argument. Part of my assessment will be whether the evidence supports your argument. Moreover, keep in mind that your results do not speak for themselves. For example, if you ran a regression, don’t just say something like “according to my regression results, my theory is correct.” Interpret the coefficient of interest and the associated p-value. Interpret any control variables. What does the overall model fit look like?
- Be sure to acknowledge your method’s limitations. This might be particularly appropriate to include in the methodology section. For example, perhaps there are some validity issues with your dependent variable. While there may be reasons your design isn’t perfect, you can (and should) argue that this is the best possible approach given resources, etc.
- Be sure to keep everything we’ve talked about in class in mind. I am assessing your knowledge of the research process by seeing how well you apply class concepts to this project. Anticipate possible objections, and justify your approach and your conclusions.
- Finally, do not be afraid to use headings and subheadings! These only serve to help guide your reader and organize your thoughts. For example, if your methodology selection has two main components, say, “case selection” and “results,” you should feel empowered to organize your paper with subheadings for these topics.
Final Submission (10% of Course Grade)
Your final submission is a polished, mixed-methods research paper that brings together the work you’ve done throughout the semester. Building on your literature review, quantitative analysis, and qualitative analysis, your paper should clearly state a research question, explain your methods, and present your findings in a coherent and compelling argument. Since you will have already submitted and received feedback on each component, this final paper is your opportunity to refine your work, integrate the parts into a unified whole, and demonstrate your growth as a political science researcher. Most importantly, your final submission should include a new section (replacing a traditional conclusion) that discusses your experiences with both of the methods (qualitative & quantitative) you chose and the relative strengths and weaknesses of those approaches to answering your research question. The specific requirements for this component are as follows:
- You final submission should contain all the following elements:
- A brief (1-2 paragraph) introduction;
- Your literature review;
- Your qualitative analysis;
- Your quantitative analysis;
- A reflection on the strengths and weaknesses of the two methods you used
- This section should be somewhere between 500-1000 words;
- Should discuss your experiences with the methods (e.g. challenges, obstacles, joys, or anything else about how it felt to actually do the research);
- Should discuss the strengths and weaknesses of both methods;
- Should conclude with some thoughts about the kinds of knowledge or conclusions you were able to reach using each method, including whether you think your qualitative, quantitative, or both methods in tandem were best suited to your research question;
- A properly formatted bibliography;
- An appendix containing the specific scripts or questions used to collect your data, if relevant (e.g. interviews, surveys, experimental treatments, etc.);
- And is submitted by Monday, December 15th at 11:59pm
Note from instructors: This prompt, particularly sections D and E which all students completed, is designed to address all 3 QCR ILOs.
[Course Name] Individual Project
By completing this individual project, you will be able to:
- Generate questions that can be answered with provided data.
- Perform EDA for
- a quantitative response variable and a binary explanatory variable
- a quantitative response variable and a categorical explanatory variable (with more than two groups)
- two (binary) categorical variables.
- two categorical variables, where at least one variable has more than two groups
- Perform inference for two means, several means, two proportions, and two categorical variables.
- Write accurate inferential conclusions and interpretations for each of these procedures.
Useful resources for this project:
- Book chapters 16, 17, 18, 20, 21, and 22.
- In class activities from Unit 2: Exploratory Data Analysis, Unit 4: Proportions, Unit 5: Means, and Unit 6: Chi-Square
- Project_data_sets.Rmd (in the Class>Project_Info Folder)
Introduction
As in the Group Project we will be using one of four datasets provided for you. Note that these datasets have been updated to include more categorical variables. Be sure to read the updated Project Data Descriptions for more details.
- Data Set 1: Marathon Runners
- Data Set 2: Canine Assisted Interventions
- Data Set 3: Song characteristics from Spotify
- Data Set 4: Champions League soccer statistics
Notice that the fifth dataset from the previous project (Strength and Conditioning) won’t be available for this project.
The datasets are available under the folder F25/Class/Project_Info/Project_data.
Descriptions of the four datasets are available under the folder F25/Class/Project_Info in the Project_data_sets file.
Overview
- You will be exploring at least two quantitative variables and at least two categorical variables.
- You are encouraged to select variables that can contribute to a broader narrative related to the dataset you chose.
- At the end of the assignment you will write a paragraph summarizing the findings from your analyses so having a thread that connects these analyses will make this stronger (and easier).
- You can build on questions your group identified in the first project submission, but the questions and analyses presented here should be entirely your own.
- You need only complete two of sections A,B, and C, But each project must complete sections D and E.
Section: Set-up
- Clearly identify the dataset you will be working with. You may continue with the same dataset or choose a different one to explore. Load in that dataset and provide a brief overview of origin of the data. You should answer the “what, where, who, how, why” of the data collection in this description.
Section A: Two-means
- Select a quantitative response variable and binary categorical explanatory variable. Identify a question that can be answered using these two variables. Clearly state this question for a general audience.
- Explore and describe the relationship between the two variables with appropriate summary statistics. Provide one plot and one sentence about the relationship (supported by summary stats).
- Perform the appropriate hypothesis test and report the
- test statistic
- p-value
- 95% confidence interval
- Comment on the role of assumptions/conditions for the test.
- State your statistical conclusion in context.
- Provide an interpretation of the confidence interval in context.
Section B: Several Means
- Select a quantitative response variable and a categorical explanatory variable with more than two groups. Identify a question that can be answered using these two variables. Clearly state this question for a general audience.
- Explore and describe the relationship between the two variables with appropriate summary statistics. Provide one plot and one sentence about the relationship (supported by summary stats).
- Perform the appropriate hypothesis test and report the
- test statistic
- p-value
- Comment on the role of assumptions/conditions for the test.
- State your statistical conclusion in context.
- Perform any additional tests, report your test statistics and p-values, and summarize your statistical conclusions in context. Interpret at least one appropriate 95% confidence intervals in context.
Section C: Two Proportions
- Identify a question that can be answered with two binary categorical variables in the dataset. Clearly state this question for a general audience, identify the explanatory and response variable, and explain the two variables in context of the data collection.
- Explore and describe the relationship between the two variables with appropriate summary statistics. Provide one plot and one sentence about the relationship (supported by summary stats).
- Perform the appropriate hypothesis test and report the
- test statistic
- p-value
- 95% confidence interval
- Comment on the role of assumptions/conditions for the test.
- State your statistical conclusion in context.
- Provide an interpretation of the confidence interval in context.
Section D: Categorical Variables
- Identify a question that can be answered with two categorical variables in the dataset. At least one of these variables will have more than two groups. Clearly state this question for a general audience, and identify the explanatory and response variable.
- Explore and describe the relationship between the two variables with appropriate summary statistics. Provide one plot and one sentence about the relationship (supported by summary stats).
- Perform the appropriate hypothesis test and report the
- test statistic
- p-value
- Comment on the role of assumptions/conditions for the test.
- State your statistical conclusion in context.
Section E: Conclusion and Figure Caption
- Write a paragraph summarizing your findings from your analyses to a general audience.
- In addition to summarizing conclusions, you should consider
- how broadly the results apply (generalizability);
- whether or not there may be confounding variables or if you can make causal conclusions;
- and if there are any shortcomings or limitations to the study or conclusions.
- When presenting findings to a general audience it is common to report confidence intervals and statements of significance (or not) but you should refrain from using words like “null”, “alternative”, “pvalue”, “test-statistic”, etc.
- A strong conclusion should reflect connections between the variables and questions you have chosen to address.
- In addition to summarizing conclusions, you should consider
- Select one Figure from your analyses above that appropriately summarizes an important conclusion from your analyses. For this figure provide a full Figure Caption.
Recall: Figure Captions
A good figure caption has four parts:
- A figure number, which is referred to in the main text (R should automatically assign these).
- Declarative sentence that summarizes the main findings or conclusions of the analysis.
- A brief description of the data and data collection methods necessary to understand the figure. This includes the way the data were measured and the units used.
- A brief description of statistical tests used and other relevant information such as p-values, test statistics, or sample sizes.
Knit this file. Submit your pdf to Moodle.
ILO #3) Evaluate interpretations derived from quantitative analysis.
Prompt (Problem 4c is assessing ILO 3):
4. Suppose a car rental place has locations in Northfield and Minneapolis. The manager of the rental place is interested in determining how many vehicles are at each location each day. They notice that:
- If someone picks up a car from Northfield, there is a 50% chance they return it to Northfield. Otherwise, they return it to Minneapolis.
- If someone picks up a car from Minneapolis, there is a 75% chance they return it to Minneapolis. Otherwise, they return it to Northfield.
(a) Find the transition matrix for this Markov Chain – you must explain why your matrix is set up the way it is
(b) In the long run, what proportion of the vehicles are at the Minneapolis location?
(c) There aren’t enough vehicles at the Northfield location. The manager of the rental place decides to have all the vehicles start at the Northfield location tomorrow. This way, more vehicles will end up in Northfield in the long run. Will this work? Justify your answer.
Assignment: homework assignment (Written Homework 13). The relevant section for this ILO evaluation is problem 4, which is stated as follows.
4. Let f(x,y) = 3√x + 2y2.
(a) Find the equation of the tangent plane to f at the point (4, 3).
(b) Use your linearization from part (a) to approximate the values of f at the points (4.2, 3.05) and (4.5, 2).
(c) Compare the approximations from part (b) to the exact values of f at the points (4.2, 3.05) and (4.5, 2). Which approximation is more accurate? Explain why this should be expected.
Note from instructors: This prompt, particularly sections D and E which all students completed, is designed to address all 3 QCR ILOs.
[Course Name] Individual Project
By completing this individual project, you will be able to:
- Generate questions that can be answered with provided data.
- Perform EDA for
- a quantitative response variable and a binary explanatory variable
- a quantitative response variable and a categorical explanatory variable (with more than two groups)
- two (binary) categorical variables.
- two categorical variables, where at least one variable has more than two groups
- Perform inference for two means, several means, two proportions, and two categorical variables.
- Write accurate inferential conclusions and interpretations for each of these procedures.
Useful resources for this project:
- Book chapters 16, 17, 18, 20, 21, and 22.
- In class activities from Unit 2: Exploratory Data Analysis, Unit 4: Proportions, Unit 5: Means, and Unit 6: Chi-Square
- Project_data_sets.Rmd (in the Class>Project_Info Folder)
Introduction
As in the Group Project we will be using one of four datasets provided for you. Note that these datasets have been updated to include more categorical variables. Be sure to read the updated Project Data Descriptions for more details.
- Data Set 1: Marathon Runners
- Data Set 2: Canine Assisted Interventions
- Data Set 3: Song characteristics from Spotify
- Data Set 4: Champions League soccer statistics
Notice that the fifth dataset from the previous project (Strength and Conditioning) won’t be available for this project.
The datasets are available under the folder F25/Class/Project_Info/Project_data.
Descriptions of the four datasets are available under the folder F25/Class/Project_Info in the Project_data_sets file.
Overview
- You will be exploring at least two quantitative variables and at least two categorical variables.
- You are encouraged to select variables that can contribute to a broader narrative related to the dataset you chose.
- At the end of the assignment you will write a paragraph summarizing the findings from your analyses so having a thread that connects these analyses will make this stronger (and easier).
- You can build on questions your group identified in the first project submission, but the questions and analyses presented here should be entirely your own.
- You need only complete two of sections A,B, and C, But each project must complete sections D and E.
Section: Set-up
- Clearly identify the dataset you will be working with. You may continue with the same dataset or choose a different one to explore. Load in that dataset and provide a brief overview of origin of the data. You should answer the “what, where, who, how, why” of the data collection in this description.
Section A: Two-means
- Select a quantitative response variable and binary categorical explanatory variable. Identify a question that can be answered using these two variables. Clearly state this question for a general audience.
- Explore and describe the relationship between the two variables with appropriate summary statistics. Provide one plot and one sentence about the relationship (supported by summary stats).
- Perform the appropriate hypothesis test and report the
- test statistic
- p-value
- 95% confidence interval
- Comment on the role of assumptions/conditions for the test.
- State your statistical conclusion in context.
- Provide an interpretation of the confidence interval in context.
Section B: Several Means
- Select a quantitative response variable and a categorical explanatory variable with more than two groups. Identify a question that can be answered using these two variables. Clearly state this question for a general audience.
- Explore and describe the relationship between the two variables with appropriate summary statistics. Provide one plot and one sentence about the relationship (supported by summary stats).
- Perform the appropriate hypothesis test and report the
- test statistic
- p-value
- Comment on the role of assumptions/conditions for the test.
- State your statistical conclusion in context.
- Perform any additional tests, report your test statistics and p-values, and summarize your statistical conclusions in context. Interpret at least one appropriate 95% confidence intervals in context.
Section C: Two Proportions
- Identify a question that can be answered with two binary categorical variables in the dataset. Clearly state this question for a general audience, identify the explanatory and response variable, and explain the two variables in context of the data collection.
- Explore and describe the relationship between the two variables with appropriate summary statistics. Provide one plot and one sentence about the relationship (supported by summary stats).
- Perform the appropriate hypothesis test and report the
- test statistic
- p-value
- 95% confidence interval
- Comment on the role of assumptions/conditions for the test.
- State your statistical conclusion in context.
- Provide an interpretation of the confidence interval in context.
Section D: Categorical Variables
- Identify a question that can be answered with two categorical variables in the dataset. At least one of these variables will have more than two groups. Clearly state this question for a general audience, and identify the explanatory and response variable.
- Explore and describe the relationship between the two variables with appropriate summary statistics. Provide one plot and one sentence about the relationship (supported by summary stats).
- Perform the appropriate hypothesis test and report the
- test statistic
- p-value
- Comment on the role of assumptions/conditions for the test.
- State your statistical conclusion in context.
Section E: Conclusion and Figure Caption
- Write a paragraph summarizing your findings from your analyses to a general audience.
- In addition to summarizing conclusions, you should consider
- how broadly the results apply (generalizability);
- whether or not there may be confounding variables or if you can make causal conclusions;
- and if there are any shortcomings or limitations to the study or conclusions.
- When presenting findings to a general audience it is common to report confidence intervals and statements of significance (or not) but you should refrain from using words like “null”, “alternative”, “pvalue”, “test-statistic”, etc.
- A strong conclusion should reflect connections between the variables and questions you have chosen to address.
- In addition to summarizing conclusions, you should consider
- Select one Figure from your analyses above that appropriately summarizes an important conclusion from your analyses. For this figure provide a full Figure Caption.
Recall: Figure Captions
A good figure caption has four parts:
- A figure number, which is referred to in the main text (R should automatically assign these).
- Declarative sentence that summarizes the main findings or conclusions of the analysis.
- A brief description of the data and data collection methods necessary to understand the figure. This includes the way the data were measured and the units used.
- A brief description of statistical tests used and other relevant information such as p-values, test statistics, or sample sizes.
Knit this file. Submit your pdf to Moodle.