ILO #1) Interpret data about the natural world.
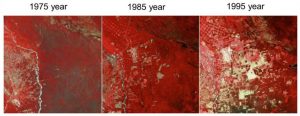
Question 20. Along the [course name] you learn to manage and interpret data about the natural environment in different ways. Observe the figure that portraits the same place in three different years (1975, 1985, 1995) in order to: 1) evaluate the data; 2) identify and describe patterns; and 3) elaborate a hypothesis. Write a short paragraph and be specific (worth 6 points).
Full Lab Report Assignment
Purpose:
This assignment is designed to help you practice constructing a scientific manuscript in [course] using data and citing journal articles. This lab report will roughly follow the standardized format that scientific articles follow. You will work with a partner to write the paper using the feedback from your lab report earlier in the semester.
Audience:
You are writing for [subject matter] students at other schools; people who have similar knowledge of [subject matter] but not about this particular experiment. And your instructor.
Format:
Aim for no more than 4 pages of 1.5-spaced text (12 point standard font), not including figures. I describe the structure below.
Subject:
Choose one of the two bacterial experiments we performed in class this semester:
- Environmental Resistance in water samples, or
- Evolving Antibacterial Resistance using selection in UV-exposed and non-UV-exposed lineages
Title:
Use a title that summarizes your findings.
Abstract:
The abstract is a stand-alone summary of the paper, typically around 200 – 300 words. Aim for 1-2 sentences summarizing each of the introduction, methods, results, and discussion. Do not reference figures or literature in the abstract.
Introduction:
The introduction starts broadly by describing the background and motivation for the project and then narrows to identify the question and hypotheses.
- Write 1-2 longer paragraph(s) broadly introducing the topic of your paper. Use this paragraph as an opportunity to frame the context of this research in a broad sense.
- Write 1-2 longer paragraph(s) that narrows down your research topic. Write more specifically about the study species or study system you will examine and explain why the research topic is important.
- Write 1 paragraph that introduces a broad question that you want to study (for example: “We assessed the relationship between group X and group Y” or “we assessed the relationship between independent variable X and dependent variable Y”.) Follow that up with a specific set of hypotheses you want to test (for example: “We hypothesized that the mean of group X will be higher than the mean of group Y because…” or “We hypothesized that variable Y will increase as variable X decreases because…”). Aim for at least 3-4 comparisons that are related to the broader question.
- Cite at least 4 relevant sources in the introduction. Each partner should find and reference two sources. Cite your sources in-text where information from that source will support an assertion made. You should have read a paper all the way through when you cite it, and reference the main ideas that originate from that paper. Think back to your library session – Web of Science is a great search tool.
Methods:
Think about the data you need to use to answer your question. You definitely collected more data than you will use in this report.
- Precisely describe the methods used to obtain the data with sufficient detail that the experiment could be replicated. Describe the reason for gathering the variables in question and why the methods used for obtaining the data were used. (e.g. “we transferred bacteria growing at the edge of the Zone of Interference in order to specifically sample the population exposed to the antibiotic”)
- Write at least one paragraph describing your analytical methods, including both a description of your statistical tests used for each comparison and a description of any figures you will make.
Results:
- Start the results section off by briefly summarizing the data you examined. It may be productive to answer these questions:
- How many samples were collected?
- How many successful trials were completed?
- What is the range of measurements recorded?
- What are mean values of measurements recorded?
- What patterns emerge from the data?
- What kind of variability or outliers exist in the data?
- Report the results of statistical tests performed, including whether the results was significant (P < 0.05) or not (P > 0.05) in a significance statement. A typical significance statement includes not only the P-value, but also the characteristics of your statistical test (see R code for more details).
- For example, I would write, “There was no significant difference between the antibacterial resistance of bacteria collected in flowing water and bacteria collected in still water (P = 0.83, t = 0.0001, d.f. = 25).”
- Produce figures that are relevant to your question and assesses your hypotheses; include a stand-alone figure legend for each. Each person should make two figures.
- Reference figures in-text by either directly stating which figure readers should reference (e.g. “…as can be seen in figure 1”) or using a parenthetical after making a statement that would be supported by the figure in question (e.g. “the mean value for group A was higher than for group B (Fig 1)”)
- Remember, you shouldn’t interpret the results here, just report them.
Example Figure + Caption:
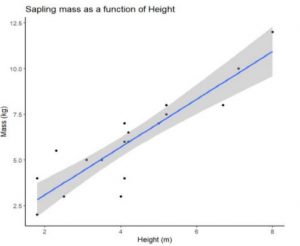
Figure 1. The relationship between the mass and height of saplings measured at St. Olaf Natural Lands, Northfield, Minnesota, USA.
Discussion:
This is the section where you try to explain the results you found and reflect on what these results may indicate. Did your results match your predictions? Why might that be the case? You should connect your results to your hypothesis and use concepts from class as well as cited literature to explain your findings.
- Contextualize, contextualize, contextualize! Place your results in the context of the literature and class concepts we have covered. This is where you get to talk about whether your results matched the expectations you put forward in your hypotheses or didn’t. If they didn’t why do you think you observed the patterns you did?
- It is important to identify limitations of a study, but your discussion should focus on what can be learned rather than solely on errors.
- Cite at least 2 sources in the discussion section to place your research in the context of other published literature.
- At the end of this section, highlight the significance of what was learned and suggest some ideas for further investigations of the study system going forward.
Acknowledgements:
Thank those who helped you with the work who are not co-authors.
Author Contributions:
Before you begin, decide what each of you will contribute. Once you have written the paper, describe who contributed what to the final paper. Eg. EKM wrote the first paragraph of the introduction and the methods and created Fig. 1. MKE wrote the second paragraph of the introduction and the results and created Fig. 2. We wrote the discussion together.
References:
Use the style for the journal Ecology.
Harville, E. W., G. Giarratano, J. Savage, V. Barcelona de Mendoza, and T. Zotkiewicz. 2015. Birth outcomes in a disaster recovery environment: New Orleans women after Katrina. Maternal and Child Health Journal 19: 2512-2522. [doi: 10.1007/s10995-015-1772-4].
In-text citations should use the (Author Year) format (Harville et al. 2015)
Remember: This assignment should be your own team’s work in your own words. No assignment is worth sacrificing your integrity.
Note: This prompt was used across several course sections/faculty within a department and was intended to be used to assess both NTS ILO 1 and ILO 2.
Guidelines for Module 3 Presentation (Summative Assignment)
The week after Thanksgiving break, you will be presenting your findings from Module 3 to your lab section. Your lab group should prepare a 20 minutes presentation (15 minute for google slides presentation and five minutes for questions from the audience). You will present it as a group. Your google slides should address the following:
- Title slide: you should have the title of your presentation, date, lab section and your group members’ names
- Brief background on water quality
- Research question – what is your research question
- Motivation behind your research question – why did you investigate it
- Work done – what tests did you choose and why did you choose them
- Work done – did you face any challenges, any observations to report
- Results
- Make sure to include a graph of your standard curve
- Organize your various tests and samples in tables (you do not need to show all of your calculations). Tables should be easy to read by your audience
- How did you expand your analysis between week 2 and 3
- Make sure to note the numbers of trials you did for each of your test
- Compare your tests to known values if you can and make sure to note your sources!
- Conclusions – what did you find, are you able to answer your research question. You can also include what you would like to investigate next if you could (“future work”)
You should make sure your slides are consistent in terms of formatting. They should use the same font type between slides and similar sized fonts between slides. For example, all of your slide tittles should be the same size. Make sure to use pictures and graphs over lengthy sentences.
TABLE 1-1: Cases of selected infectious disease in the United States before and after the introduction of effective vaccines
| Disease | ANNUAL CASES/ YR Prevaccine |
CASES IN 2016 Postvaccine |
CASES IN 2019 Postvaccine |
Increase from 2016 to 2019 |
|---|---|---|---|---|
| (%) | ||||
| Smallpox | 48,164 | 0 | 0 | — |
| Diphtheria | 175,885 | 0 | 2 | + |
| Measles | 503,282 | 79^ | 1,275 | 1,614 |
| Mumps | 152,209 | 145* | 3,780 | 2,607 |
| Pertussis (“whooping cough”) | 147,271 | 964* | 18,617 | 1,931 |
| Paralytic polio | 16,316 | 0 | 0 | — |
| Rubella (German measles) | 47,745 | 0* | 6 | + |
| Tetanus (“lockjaw”) | 1,314 (deaths) | 1* (case) | 26 (cases) | 2,600 |
44) (10 pts) Evaluate the data on the table above and answer the questions A, B and C below.
A) Which 4 diseases show the greatest increase in cases from 2016 to 2019?
B) Name the vaccine that can prevent each of these 4 infections? (as discussed in class)
C) What do these data tell us about the trend in vaccine prevention in the U.S.? Why is this concerning?
ILO #2) Communicate ideas using scientific principles and data.
REPLACE WITH A REPORT TITLE
Assignment prompt
Read Section 2.3 Case Study 1: Island Biogeography, and complete Exercises 2.10-2.16. These exercises will guide your report, but there should be no reference to individual exercises in the report. Be thoughtful in how you communicate your findings, and keep the audience in mind.
Abstract
Summarize your report in 3-6 sentences.
Introduction
Explain the question(s), the background information needed to place the question(s) in context, and the goal of the report. Include citations (e.g., the textbook, or references cited by the textbook) where appropriate. Put everything in your own words in 1-2 paragraphs, and do not plagiarize or directly quote the textbook.
Methodology
Outline your approach to answering the question(s). Explain the model assumptions (including the justification for those assumptions), the model, the model behavior (i.e., what happens when you change parameter values), and the data (including units).
Results
Explain the model calibration (e.g., parameter estimation) and other analyses (e.g., equilibria). All figures should have labels and captions that explain what’s going on in the plot without needing to read the entire report. All reported numbers should include units.
Discussion
Reflect on how well the model explains the data, how the model could be improved or expanded, and new questions for future work. The textbook suggests some further exploration that could inspire future questions.
References
Include bibliographic information cited in the report (including the textbook). Any consistent citation style is fine.
RESPONSE #4:
Below you will find descriptions of the hypotheses and results from three studies along with a series of statements that interpret those results. One of these statements for each study is false. Your assignment is to identify the false statement and, through referencing the appropriate pattern of data (i.e. main effects, interactions, simple effects), explain why it is incorrect. This shouldn’t take more than a brief paragraph for each.
STUDY 1:
Do people’s attitudes about the guilt of a criminal who is subjected to torture depend on how much pain the torture victim appears to be experiencing, and how physically close people are to the torture victim?
IV’s: Pain displayed by victim (No Pain, Pain); Association with Torture (Close, Distant)
DV: How guilty people judge the tortured victim to be for an alleged crime.
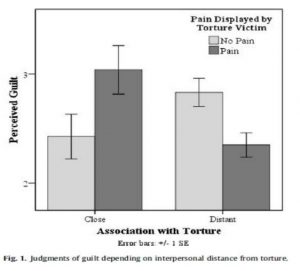
Which of the statements below is not an accurate description of the data, and why?
a) Perceiving pain increased innocence for those distant, but not for those close, to the victim
b) Distant participants judged the victim to be more guilty when experiencing no pain than when experiencing pain
c) Distant participants judged the victim to be more guilty than the closer participants
d) More pain increased innocence for those distant from, but not for those close to, the victim
STUDY 2:
Do the social rewards people get from their Facebook wall posts (i.e. the amount of likes/comments their posts receive) depend on their own self-esteem as well as the positivity of the content of their posts?
IV’s: Self Esteem (Low vs High); Positivity (Low vs High)
DV: Social Rewards Score (composite score of Likes/Comments)
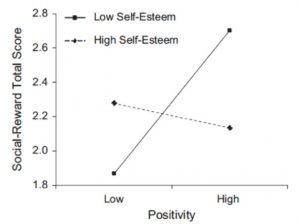
a) people with low self-esteem are not rewarded for their tendency to express negativity
b) participants with high self-esteem garnered more social rewards from friends when expressing positivity, but those with low self-esteem did not
c) friends of participants with low self-esteem lavished more rewards the more positive the posts were, perhaps trying to encourage the atypical behavior
d) participants’ with high self-esteem were rewarded more when their posts were low in positivity than high in positivity
STUDY 3:
Will people judge patients who are in persistent vegetative states (PVS) to have more diminished mental capacities (i.e. perceive them to have less “mind”) than people who are actually dead? And will the effect of body state on mind perception depend on how religious people are?
IV’s: Body state (Dead, Corpse, PVS); Religiosity (Low, High)
DV: Judgments of Mind Perception (extent to which entities are capable of feeling and thinking)
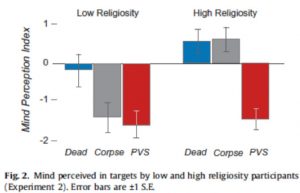
a) PVS patients were seen as having reduced mental capacity compared to dead person regardless of religiosity
b) The state of the patient (dead or PVS) influences judgments of mind more strongly for the highly religious
c) strong religious beliefs allowed participants to ascribe minds to the dead whether they were conceived of as a corpse or as just “dead”
d) Judgments of the minds of PVS patients depend on the religiosity of the participants
Note: This prompt was used across several course sections/faculty within a department and was intended to be used to assess both NTS ILO 1 and ILO 2.
Guidelines for Module 3 Presentation (Summative Assignment)
The week after Thanksgiving break, you will be presenting your findings from Module 3 to your lab section. Your lab group should prepare a 20 minutes presentation (15 minute for google slides presentation and five minutes for questions from the audience). You will present it as a group. Your google slides should address the following:
- Title slide: you should have the title of your presentation, date, lab section and your group members’ names
- Brief background on water quality
- Research question – what is your research question
- Motivation behind your research question – why did you investigate it
- Work done – what tests did you choose and why did you choose them
- Work done – did you face any challenges, any observations to report
- Results
- Make sure to include a graph of your standard curve
- Organize your various tests and samples in tables (you do not need to show all of your calculations). Tables should be easy to read by your audience
- How did you expand your analysis between week 2 and 3
- Make sure to note the numbers of trials you did for each of your test
- Compare your tests to known values if you can and make sure to note your sources!
- Conclusions – what did you find, are you able to answer your research question. You can also include what you would like to investigate next if you could (“future work”)
You should make sure your slides are consistent in terms of formatting. They should use the same font type between slides and similar sized fonts between slides. For example, all of your slide tittles should be the same size. Make sure to use pictures and graphs over lengthy sentences.