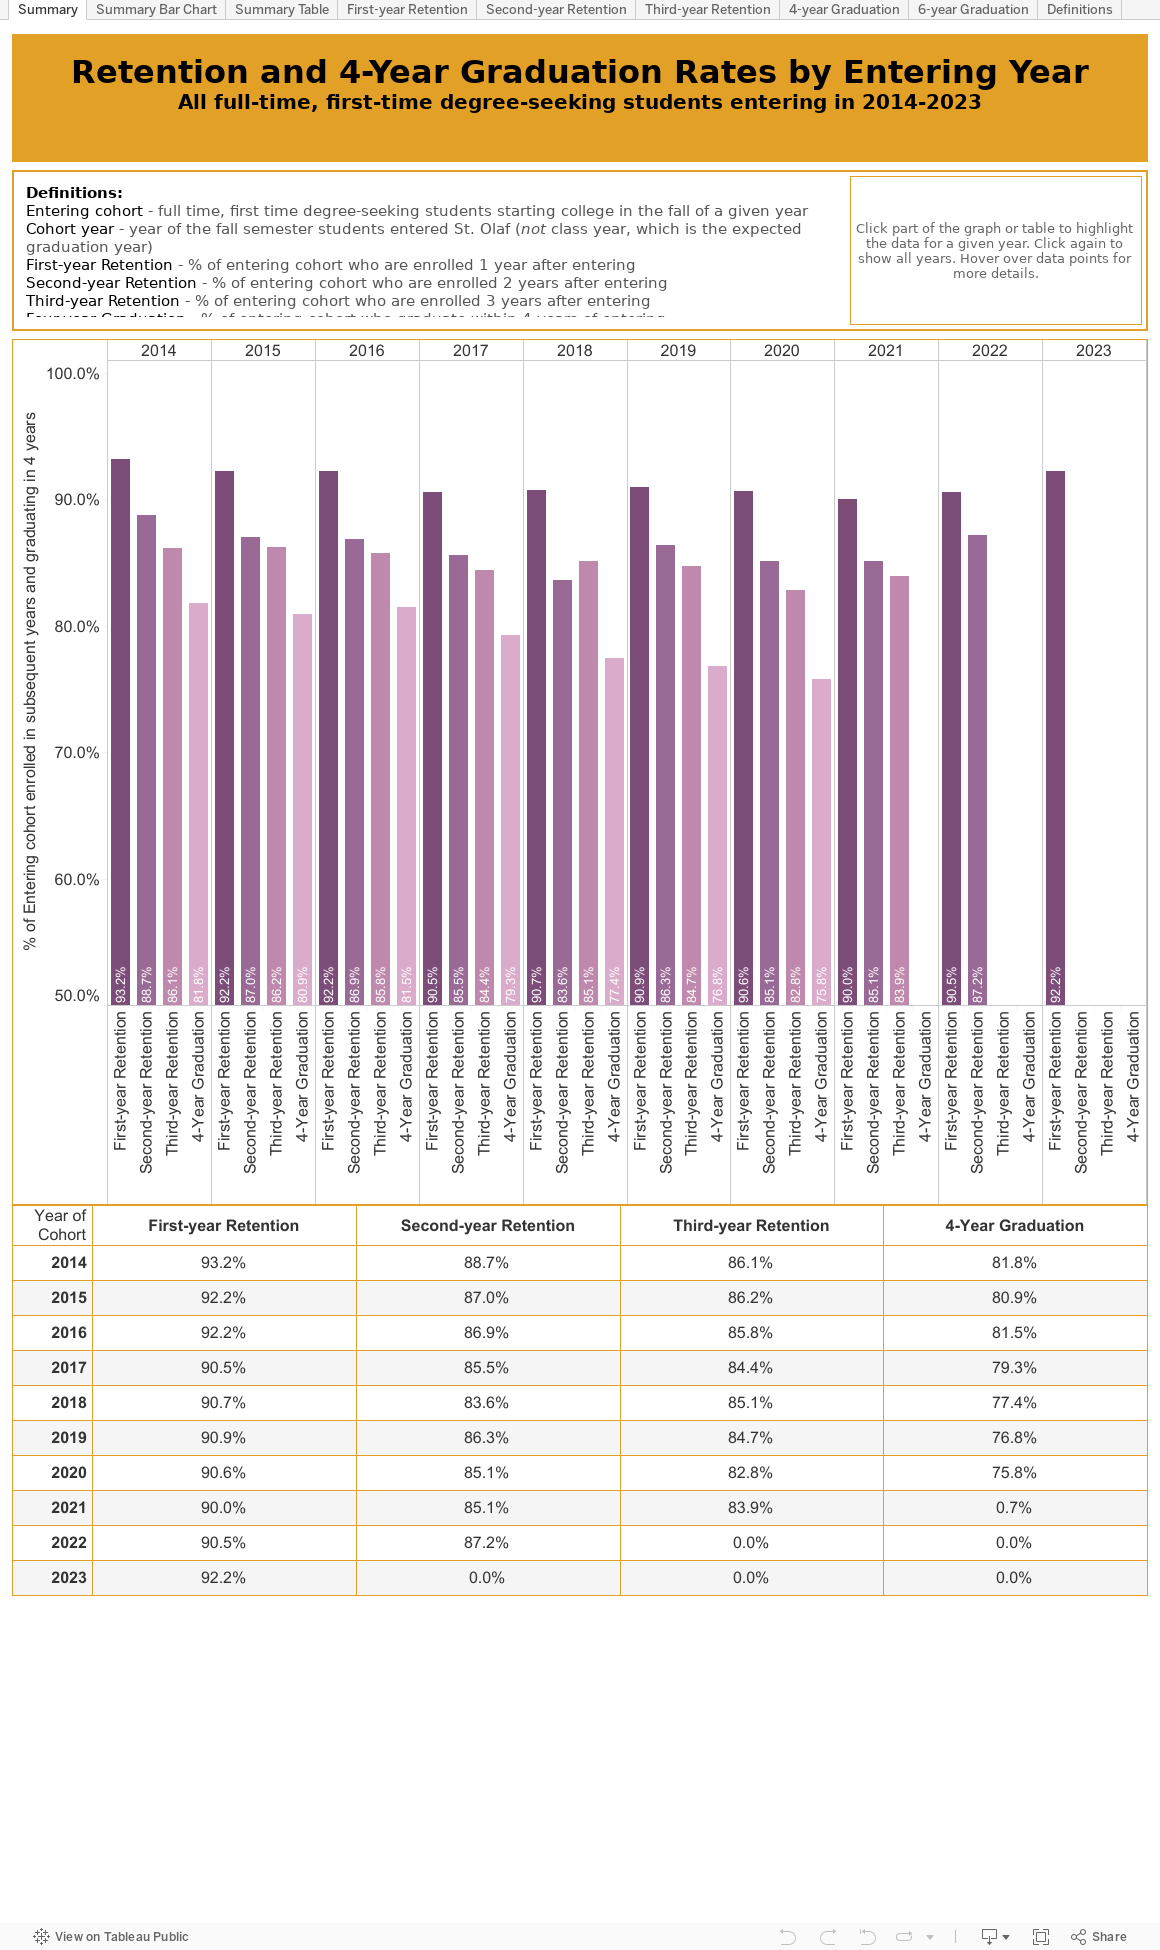
These dashboards show retention and graduation rates. The data are displayed by the entering year of new students, also known as the cohort year. The retention pages track the percentage of each entering cohort that is enrolled 1 year, 2 years, and 3 years later. The graduation pages show the percent of each cohort who graduated within 4 years and 6 years. See the “Definitions” page for more details on how each rate is calculated and for demographic definitions.
Note: Annual updates may introduce minor changes to prior years, as our data are updated or corrected each year.
Click on the tabs below to view each page. The summary provides an overview of retention and 4-year graduation, while the other pages focus on each rate and provide breakdowns by demographic groups. The demographic choices you make on one page will remain as you view the other pages.